

Watco Fundamentals · Part 5
Why Cooling Efficiency Slowly Disappears — Without Anyone Noticing
Most cooling systems don’t suddenly become inefficient. They drift — slowly, quietly, and usually with a perfectly reasonable explanation ready for every step of the way.
The drift nobody catches
Cooling efficiency rarely disappears in a single event. There is no alarm, no sudden spike in energy consumption, no moment where something clearly goes wrong. Instead, performance erodes gradually — week by week, season by season — in a way that almost never triggers a meaningful response.
This is cooling efficiency drift. And what makes it particularly difficult to manage is not the physics of how it happens, but the organisational dynamic that allows it to continue unnoticed.
Why seasons create the perfect cover
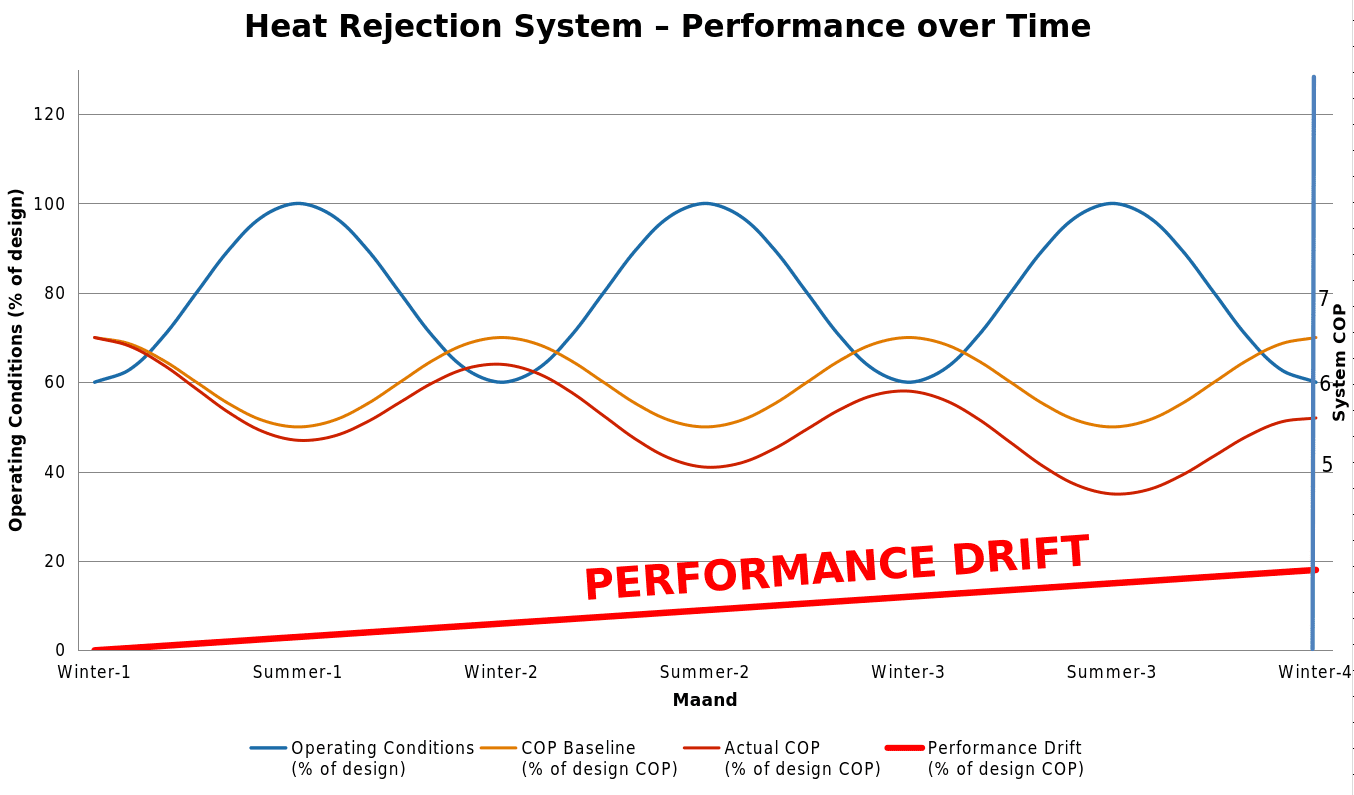
Cooling system performance is not constant across the year. In summer, high ambient temperatures and peak process loads push the system toward its design limits. Efficiency — expressed as COP or any equivalent metric — naturally falls. In winter, the same system under lighter load and more favourable ambient conditions should perform noticeably better.
This seasonal variation is normal and expected. But it creates a problem.
When efficiency drops in summer, the explanation is always available: it’s the heat. The system is working harder because conditions are harder. That is often partly true. But it is also the explanation used when the system is working harder than it should be — when fouling, flow degradation, or other performance losses are contributing to the decline alongside the weather.
The seasonal excuse is plausible enough that the real signal gets lost.
The winter that doesn’t recover
The more revealing moment is winter — and it usually passes without comment.
If a system has been drifting throughout summer due to genuine degradation, the improvement in cooler weather should be measurable but partial. The system runs better than in peak summer, but not as well as it should given the more favourable conditions. The expected seasonal recovery does not fully materialise.
In most plants, this goes unnoticed. Winter performance is better than summer — that is enough. Nobody asks whether it is as good as it should be. There is no obvious reference point for what “as good as it should be” actually means under the current conditions.
So the system is accepted as healthy. The degraded state becomes the new normal.

The disappearing baseline
This is the mechanism behind efficiency drift: the gradual disappearance of the original performance baseline.
When a system is new and clean, there is an implicit reference point — what it achieves under a given set of conditions. Over months and years, as deposits accumulate, components age, and small degradations compound, the system achieves less under those same conditions. But because the change is gradual, and because seasonal variation always provides a contextual explanation, the original reference point is never checked against.
By the time anyone notices that efficiency is persistently lower than it should be, the baseline has long since been forgotten. People remember that the system ‘used to run better,’ but cannot quantify by how much, under which conditions, or since when.
The rationalisation trap
Most operational dashboards show absolute performance: COP, kW consumed, temperatures, pressures. These numbers are useful for detecting acute failures. They are poor tools for detecting gradual drift, because they do not account for operating conditions.
A COP of 5.4 on a mild day with low load looks different from a COP of 5.4 on a hot day at full load. Both might be reported and accepted without comment. But whether each represents good or poor performance relative to what the system should be achieving under those specific conditions is a different question entirely — and one that absolute metrics cannot answer.
The rationalisation trap: every data point has a plausible explanation. Summer is hot. Load is high. The system is old. The numbers always make sense in context — which means the underlying drift never triggers a response.
What relative evaluation changes
The alternative to monitoring absolute performance is monitoring performance relative to operating conditions — evaluating what the system achieves against what it should theoretically achieve given its current load, ambient conditions, and design parameters.
One way to express this is as a percentage of theoretical maximum efficiency — sometimes referred to as a System Efficiency Index, or SEI. The SEI expresses a system’s actual COP as a percentage of the Carnot COP: the theoretical maximum COP that a perfect system could achieve under identical operating conditions. Because real-world refrigeration systems cannot reach that theoretical ceiling, a well-performing system in practice reaches roughly 42–50% of its Carnot COP. A system running at 85% of its theoretical maximum is performing well — but that 85% translates to approximately 42.5% on the SEI scale. The full explanation of how the SEI is calculated and applied is on the EQOCHECK page.
What this approach makes possible is meaningful comparison across different operating conditions. A system running at 85% of its theoretical efficiency on a hot day and 85% on a cold day is performing consistently. A system running at 85% in summer and 78% in winter — when conditions are more favourable and the index should hold or improve — is drifting, even if both readings look acceptable in isolation.
Relative evaluation removes the seasonal excuse. It answers not how efficient is the system? but how efficient is the system relative to what it should be right now?
The connection to what came before
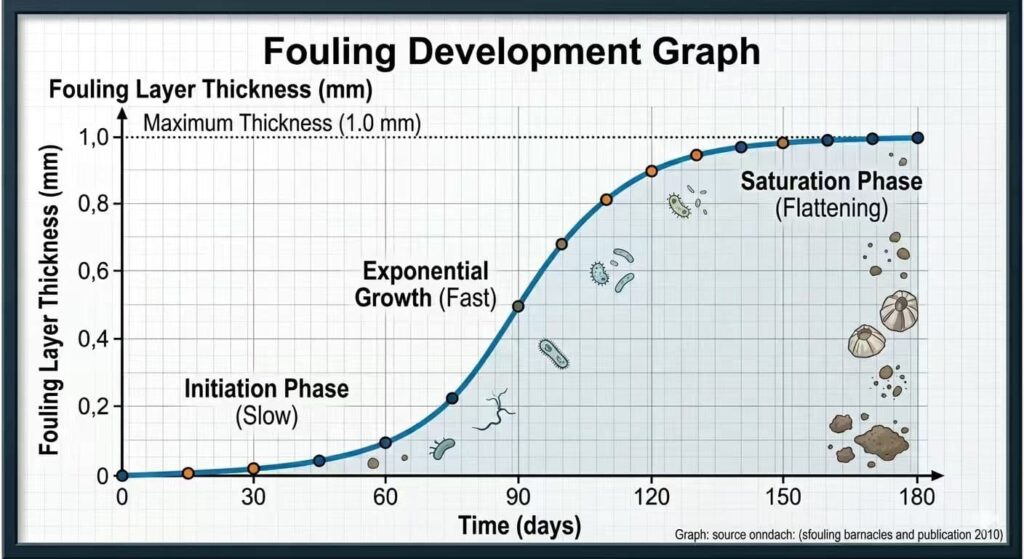
In Part 4, we looked at how condenser fouling develops as a slow, continuous process — invisible in the early stages, only detectable when the damage is already significant. Cooling efficiency drift is the same phenomenon at the system level.
The causes are the same: fouling, flow degradation, component wear. The mechanism is the same: gradual accumulation, no single trigger, always a plausible contextual explanation. And the consequence is the same: by the time it is visible, more has been lost than needed to be.
The system still cools. But relative to the conditions it is operating under, it is slowly becoming less efficient — and without a framework for relative evaluation, that difference will continue to go unnoticed.
Monitor efficiency relative to operating conditions.
EQOCHECK evaluates your chiller’s actual performance against its theoretical maximum — making efficiency drift visible before the baseline disappears.
This article is part of the Watco Fundamentals series.
What is Cooling? | F01
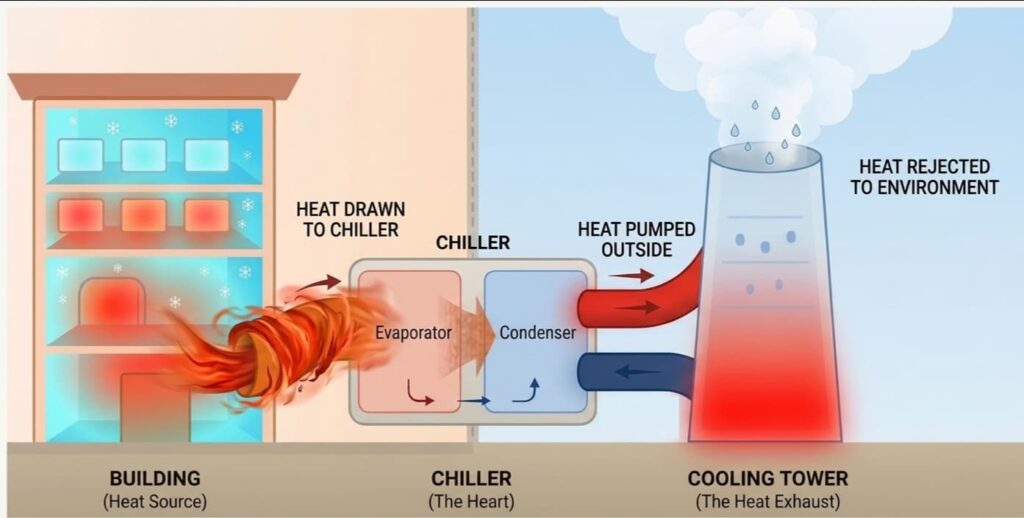
Heat Removal in Cooling Systems | F02
What are Heat Rejection Design Conditions | F03
Condenser Fouling Process | F04