Condenser Cleaning ROI-Calculator
Discover how fast EQOBRUSH can reduce your energy costs and pay back your investment through minimizing the impact of fouling.

Find out how fast EQOBRUSH pays for itself.
Fill in your chiller plant data below to get an instant estimate of your energy savings, payback period and CO₂ reduction. Working in a local currency? Set your currency symbol and exchange rate — all figures update automatically. When you're done, print or save the result as a PDF to keep for your records.
Send your results to Watco
We'll send a copy of your ROI estimate to your inbox and have a sales engineer follow up with you.
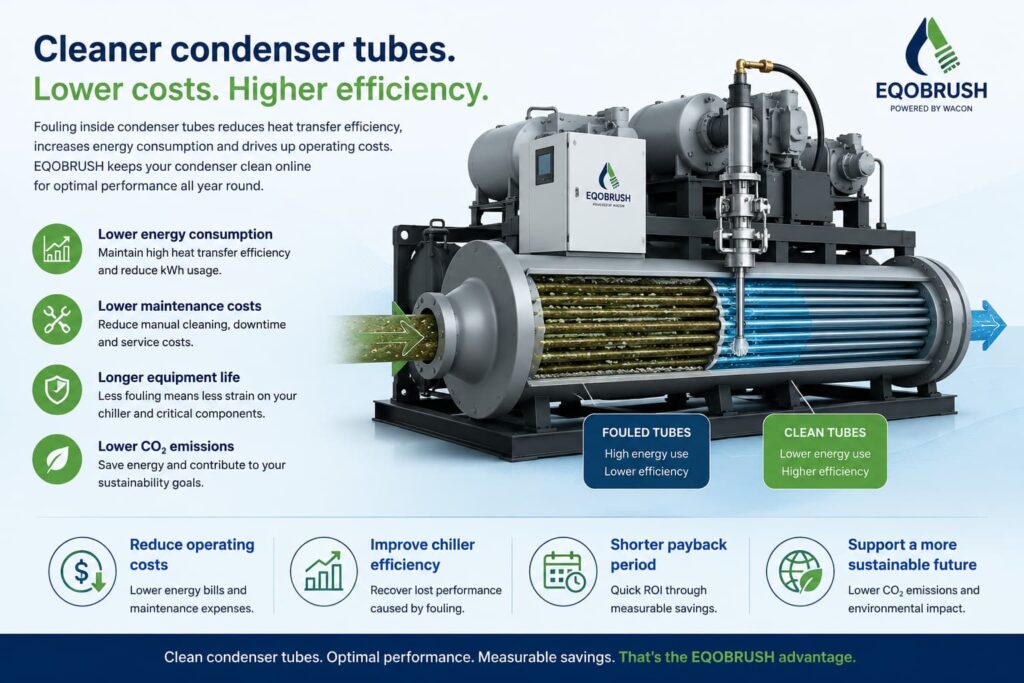
Poor condenser performance is one of the most overlooked causes of excessive chiller energy consumption. Even a relatively small amount of fouling inside condenser tubes can significantly reduce heat transfer efficiency, forcing compressors to work harder to maintain cooling capacity. Over time, this hidden efficiency loss increases electricity consumption, operating costs, and mechanical stress on critical chiller components. It is easy to fix.
This Condenser Cleaning ROI Calculator helps facility managers, HVAC engineers, and plant operators estimate the financial impact of condenser fouling and the potential savings of automatic online tube cleaning systems such as EQOBRUSH. By maintaining cleaner condenser tubes during operation, water-cooled chillers can operate closer to their intended design efficiency throughout the year.
The calculator provides a first-order estimate of energy savings, maintenance reduction, payback period, and CO₂ emission reduction based on your operating conditions. Results can vary depending on seasonal load profiles, cooling water quality, and part-load operation. For a more accurate assessment, a detailed IPLV-based analysis and review of historical operating data is recommended.
EQOBRUSH systems are used in industrial facilities, commercial buildings, and data centers to reduce fouling-related efficiency drift, optimize condenser performance, and improve long-term chiller reliability and operational stability.